The Sonar collective
By Kim Hollamby
The Sonar collective
By Kim Hollamby
A social revolution among thousands of boat owners around the globe is improving the detail we can access with regard to the shape and nature of sea, lake and river beds. This is a particularly welcome development in less travelled waters and uncharted lakes and rivers, but why is this necessary in the first place?
In this age of GPS-assisted car driving, we reasonably expect every road to be mapped out in sufficient detail so that we never get lost. Occasionally, we need a software update to include the latest road construction and traffic flow changes. However, unless off-roading up an unpopulated country track, it’s extremely unlikely you’ll be left to work things out for yourself.
In the face of our day-to-day experience in a vehicle, you might assume the information you see on a marine chart is real-world accurate down to the tiniest detail, but there are good reasons why this is not always the case. Rocks may not move, but river, lake and sea beds can change their characteristics, sometimes after just one storm or flood. We also need to consider – was the area I do my boating in ever charted correctly in the first place?
Let’s take a step back to paper charts to understand why we’ve asked that last question.
Source data for navigation charts
If you pick up a traditional sea chart and look at the source data panel printed on it, be prepared to be surprised by the dates you find there. In areas of high shipping and boat traffic it’s very likely that the professional hydrographic surveys upon which charts are based were conducted relatively recently. If you navigate into shallower or less-frequented waters though then don’t then be surprised to see that the survey is old and may even date back 100 years or more. To put that in context, we were still conducting hydrographic surveys with a lead line until at least the mid 20th Century.
Although often a highly accurate method, there is a finite number of times you can sound the bottom with a lead line. Intermediate chart depth contours were often interpolated between the soundings. The need to interpolate between bottom readings is still necessary today because even with modern sonar transducers pinging at 20 data points per second, you still cannot cover every inch of the bottom. Although our maps today are much more accurate thanks to technology, if unique features of a bottom are not physically sounded by a survey vessel, those features will not show up on any map. It gets more interesting again if you head into a remote bay, or inland up a creek or river that has little navigable function other than pleasure boating. These areas may never have been accurately surveyed.

The challenges of poorly surveyed waters
Entering waters that are not surveyed or that were last sounded many years ago is a fun challenge, as long as you understand that you are much more dependent on your own skills.
As a general tip, the more remote the area, the more you should not place complete reliance on the chart and keep a careful eye on other indicators, like your depth sounder, a sonar display if you have one, changes in water surface and colour – and even the dead giveaway of why other boats are clustered in certain areas!
Now before we get too upset about the fact that marine charting is unlikely to be as reliable as car maps when we hit the waterborne equivalent of a minor road,
remember that two-thirds of the Earth’s surface is water. Less than 0.2 per cent of the land mass is some form of road, car park, train track, yard, hard standing or airport runway. Aside from the odd tunnel, everything is visible from the air too, which makes cartographers’ jobs much easier.
Hydrographic organisations around the world are using technology like never before to update marine charts and ensure we can navigate safely. Given the sheer scale of the task though you can understand that there are times when leisure boat owners have to be smarter than just putting their faith in formal maritime cartography. Fortunately, we have access to technologies that give us distinct advantages compared to the lead-line swinging sailors of old.
Digital revolution in sounding
Today’s leisure boat owner has never had more information regarding the world beneath their keel. There have been exciting new developments in this area of marine electronics in the last decade, driven in part by people wanting to find fish, but with excellent spin-off benefits for all skippers. Simrad® is a world leader in bringing these rich layers of instant underwater perception right into your boat’s integrated electronic displays.
Graphical representations of what lies beneath are now available on equipment for the smallest craft up to superyachts, providing not only a real-time depth sounder readings below the boat, but full colour 2D and 3D visualisations of the depth contours and water bed composition around you.
We’ll be exploring some of the features and practical applications for Simrad® sonar systems in future articles, including the forward looking sonars in the range. What, though, if you could go the next step and record your exploration for later reference? Or better still, collaboratively share that data for the benefit of others and access maps compiled from their sonar soundings too?

A social charting revolution
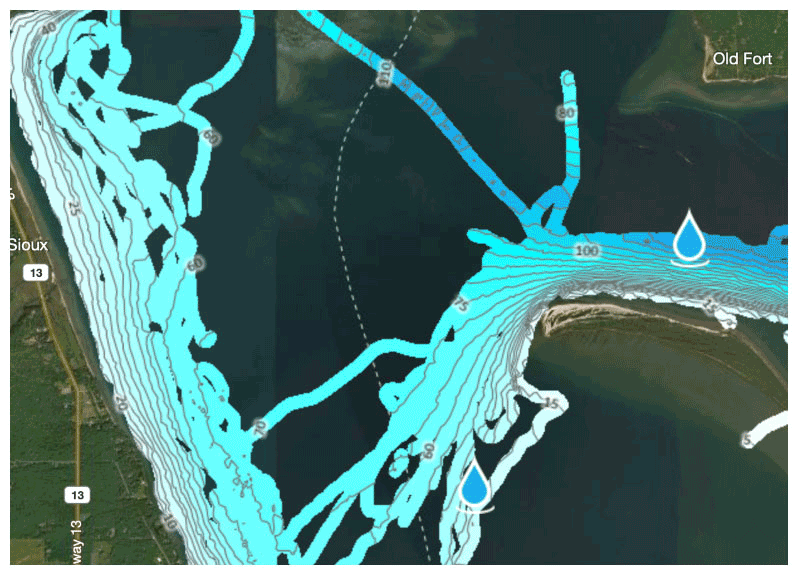
That is the premise of Genesis® from cartography specialist C-MAP®, a sister company to Simrad® within the Navico® group. The heart of the concept is the system’s ability to automatically create a downloadable map file in the cloud from sonar logs that you record on your compatible Simrad® system and then upload. These map files are not designed as a replacement for your charts – they are an enhancement to provide richer levels of detailed information about the areas in which you do your boating. Once you record a particular underwater feature, you don’t need to keep remembering it. This level of Genesis subscription is free of charge.
If you register for Edge, the paid subscription version of Genesis, there are a number of enhanced ways you can work with your own maps, including merging multiple sonar tracks to make a master, viewing the bottom hardness in colour-coded zones, replaying your sonar recordings and choosing to keep your data – and perhaps your latest, greatest fishing spot – a secret.
You can also add a ‘vegetation’ layer, to identify areas of water bed where submerged vegetation (or “grass”) grows. This feature is geared to the fishing community to help them find and catch fish. Other boat owners could equally use this to mark areas of sea grass, coral and other sensitive environments where you want to avoid dropping an anchor.
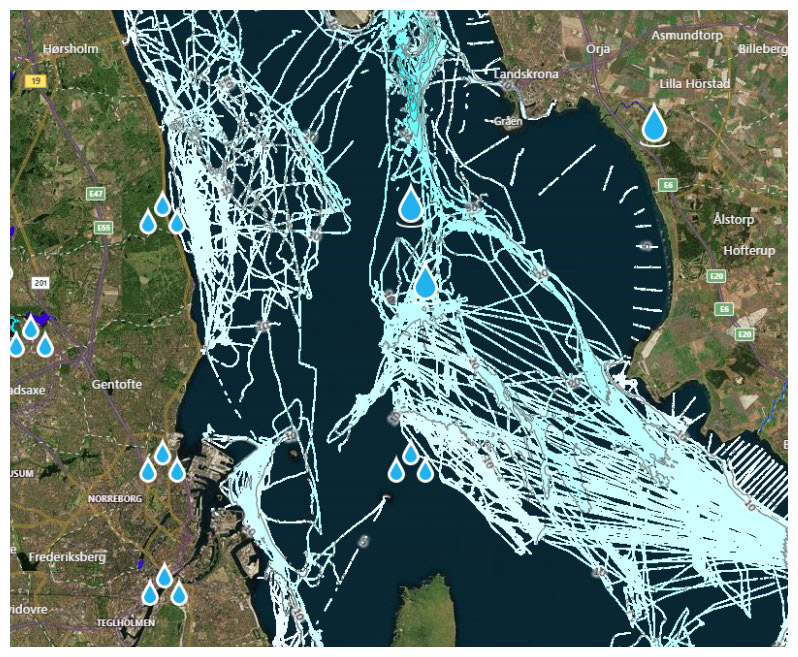
Genesis also offers a global collection of free Social Maps generated by other users. For a fascinating glimpse into how the pieces in the world’s largest jigsaw puzzle are coming together, you can freely access [genesismaps.com/Dashboard/SocialMap](https://genesismaps.com/SocialMap). You’ll see in some cases whole areas have been covered; in other examples at the moment, the uploaded log files have come from a passage conducted from A to B. Over time, it’s certain that more of the gaps will be filled.
Simrad® integration with Genesis
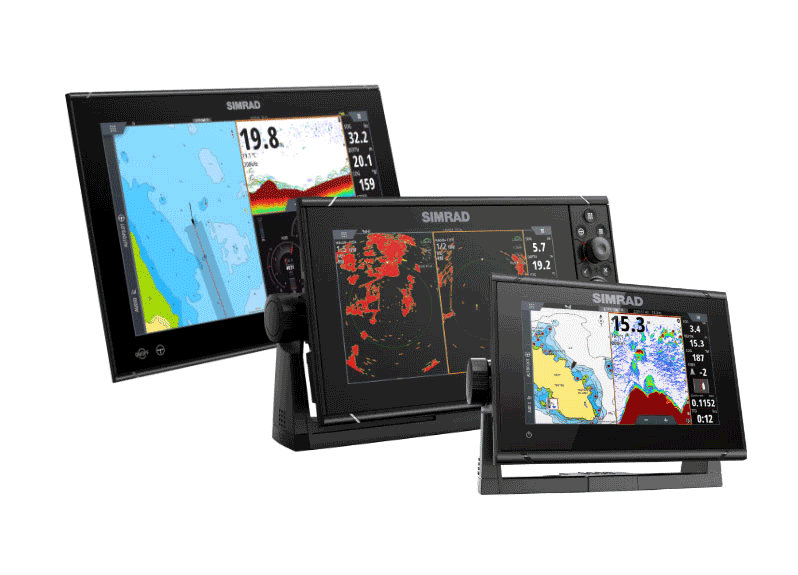
Given integration to a compatible sonar, the Simrad® chartplotters, fishfinders and multifunction navigation systems able to take advantage of C-MAP Genesis are the NSO™, NSS™ and GO™ families.
To read more about C-MAP Genesis and view videos of the system in action visit


